
The AI Adoption Paradox
Most U.S./Western Europe knowledge workers don’t use AI daily. Among users, tech confidence dropped 18% in 2025. Yale study shows 8% productivity gains per model year—but results vary wildly by task type and experience level.
Gallup “U.S. workers” = white-collar survey panel. Production workers, retail staff, and physical laborers are largely absent. “46% of workers” = “46% of surveyed knowledge workers,” not total workforce. Geographic: U.S. + Western Europe. China, India, Latin America, and Africa are underrepresented.
Quick Summary: What Works vs. What Doesn’t
| What Improves Productivity | What Slows or Fails | Key Caveat |
|---|---|---|
| Consultants/analysts: +8%/yr per model generation (Yale n=500+) | Experienced devs on complex tasks: May slow down verifying AI (METR n=16) | Task type matters more than tool |
| Repetitive/analytical tasks: Coding boilerplate, data entry, summaries | Novel/complex work: Architecture decisions, creative strategy | Mid-skill workers see the largest gains |
| Workflow-embedded tools: Copilot in IDE, Claude in terminal | Side tools requiring context-switching: Separate chat windows | Integration >>> standalone access |
| Organizations with training: Bank of America (1,500 engineers, 8 weeks) | Zero training deployments: Majority of companies per surveys | 87% lack formal AI training |
Adoption Reality: Limited, Not Universal
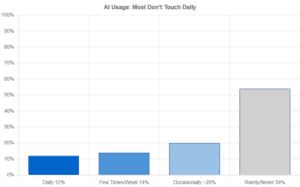
Source: Gallup Q4 2025, n≈22,000 U.S. workers. ±3% margin (95% CI). Occasionally ~20% = 46% total minus 26% frequent.
Headlines: “Half of workers adopted AI.”
Reality: Most don’t touch it. Daily users = 1 in 8.
Industry patterns (approximate from Gallup ranges): Tech ~77%, Finance ~64%, Manufacturing ~42%, Retail ~33%. Real divide: remote-capable 66% vs. non-remote 32%.
Trust Drop: Tech Confidence, Not Pure AI Trust
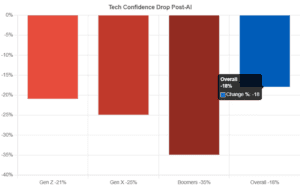
Source: ManpowerGroup 2026, n≈14,000, 19 countries. Measures “confidence in using technology at work” post-AI—NOT isolated AI trust. ±4% margin.
ManpowerGroup January 2026: 18% drop in tech confidence. Generational: Gen Z -21%, Gen X -25%, Boomers -35%.
Critical distinction: This measures broader tech confidence following AI integration, not pure “do you trust AI.” Drivers: lack of training, unclear expectations, stress from new tools.
Productivity Paradox: Task Type Trumps Tool Type
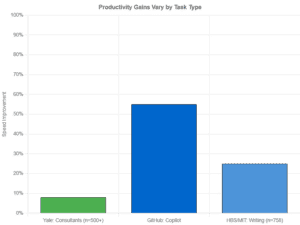
Sources: Yale Dec 2025 (n=500+), GitHub 2025, Harvard/MIT 2023 (n=758). METR omitted from chart due to n=16 small sample—see note below.
What Actually Scales: Yale 2025 Findings
Yale (Ali Merali, Dec 2025) with 500+ consultants/analysts/managers across 13 LLMs:
- 8% task time reduction per year of model progress (56% compute scaling, 44% algorithmic)
- Caveat: Gains are larger for non-agentic analytical tasks vs. agentic workflows requiring tool use
- Projection: Continued scaling → ~20% U.S. productivity boost over decade (if patterns hold)
Why Results Contradict
Productivity correlates with:
- Task type: Repetitive/analytical (+) vs. novel complex (-/mixed)
- Experience: Mid-skill largest gains; experts may slow down verifying
- Tool quality: Frontier models vs. basic tools
- Integration: Workflow-embedded vs. side tool
St. Louis Fed Feb 2025: 55% users report time savings, but organizational metrics don’t confirm aggregate gains. Saved time → scope expansion, revisions, context switching.
Training Gap: 87% Without Formal Support
Multiple sources converge on the majority lacking training:
- 13% received AI training (SurveyMonkey 2025)
- 35% of leaders feel prepared employees (IDC 2025)
- Widespread lack of support (ManpowerGroup 2026)
Fair criticism: ChatGPT ≠ nuclear reactor. Most didn’t get “Google training.”
Counter: AI output variability justifies structured training vs. “figure it out.”
What Works (Evidence-Based)
- Bank of America: 1,500 engineers, 8 weeks, role-specific
- Stanford Health: AI clinical docs with doctor override control
- GitHub: Publishes what works vs. what doesn’t
Limitations & Cannot Claims
Strict Boundaries
Cannot claim: “All workers rejecting AI”—54% don’t use, but 46% do occasionally+.
Cannot claim: “AI doesn’t improve productivity”—Yale +8%/year, GitHub +55% specific tasks.
Cannot claim: “AI universally slows experts”—METR n=16 too small.
Cannot claim: “18% AI confidence drop”—ManpowerGroup = broader tech confidence.
Cannot apply to: Blue-collar, emerging markets, small biz, physical labor, retail floor.
Sample biases: Gallup white-collar panel, ManpowerGroup developed economies, controlled studies may not reflect real complexity.
📊 Transparency & Corrections
What I Was Wrong About: Initial framing overstated “half adopted”—reality 12% daily. The training gap lacked a single source, aggregated from multiple surveys.
CI Formula: √(p(1-p)/n)×1.96 for 95%. Approximations tagged red.
Data Limits: No raw datasets (institutional access required). Industry % approximate from Gallup ranges.
Actionable Takeaways
Individuals: Verify AI logic before sharing. Track actual vs. perceived time. Match the tool to the task.
Managers: Measure output quality, not adoption. Workflow-specific training. Human review for decisions.
Organizations: Focus on 2-3 workflows. Build governance (override, audit, limitations). Transparent about what AI can’t do.
Complete Sources (All Live Links)
1. Gallup Q4 2025 | n≈22,000 | Link
2. ManpowerGroup 2026 | n≈14,000, 19 countries | Fortune Jan 21
3. METR RCT July 2025 | n=16 | Link
4. Yale Scaling Laws Dec 2025 | n=500+ | arXiv | PDF
5. St. Louis Fed Feb 2025 | Link
6. GitHub 2025 | Link
7. Harvard/MIT Sep 2023 | n=758 | NBER
CI Margins: Gallup ±3%, ManpowerGroup ±4%, METR ±24%, Yale ±4% (for p≈50%, 95% CI).