Written by: Tom Morgan is responsible for editorial decisions.
Last Updated: October 7, 2026
Topic Horizon: Workplace AI adoption, ROI measurement, agentic AI governance, and the individual-vs-organizational usage gap
Table of Contents
- The Number Nobody Agrees On
- The Adoption-Impact Gap: Why “Everyone Uses It” and “It Works” Are Different Claims
- Shadow AI: The Workforce Adopted Before IT Did
- Workslop: The Productivity Tax Nobody Budgeted For
- What the 5% Do Differently
- Actionable Implementation Checklist
- Frequently Asked Questions
- References & Verification Methodology
💡 Executive Summary / Direct Answer: AI use at work is real but overstated: roughly 21–52% of employees actively use it depending on how “use” is defined, while McKinsey’s 2025 organizational tracking shows 88% adoption of at least one AI tool. MIT’s NANDA initiative found 95% of enterprise generative AI pilots show no documented P&L impact—the gap traces to missing success metrics and integration failure, not model quality—and the report itself is preliminary, non-peer-reviewed industry research.
<div id=”the-adoption-number”></div>
The Number Nobody Agrees On
Ask five research firms, “How many workers use AI on the job?” and you’ll get five different answers, and none of them are lying. They’re measuring different things.
Pew Research Center’s late-2025 survey put U.S. worker AI use at about 21%, up from 16% a year earlier, with daily use at roughly 10% of the workforce [Source: Pew Research Center, “About 1 in 5 U.S. workers now use AI in their job”]. Gallup’s Q2 2026 workforce panel of 22,573 employed U.S. adults found 52% use AI in their role at least a few times a year, with 30% using it a few times a week and 15% daily, up from 41% organizational integration in Q1 2026 [Source: Gallup, “Rising AI Adoption Spurs Workforce Changes,” 2026]. SHRM’s March–April 2026 survey of 5,875 U.S. workers landed on 47% saying their organization has implemented AI—and an equal 47% saying it hasn’t [Source: SHRM, “Navigating AI in the Workplace: 2026”].
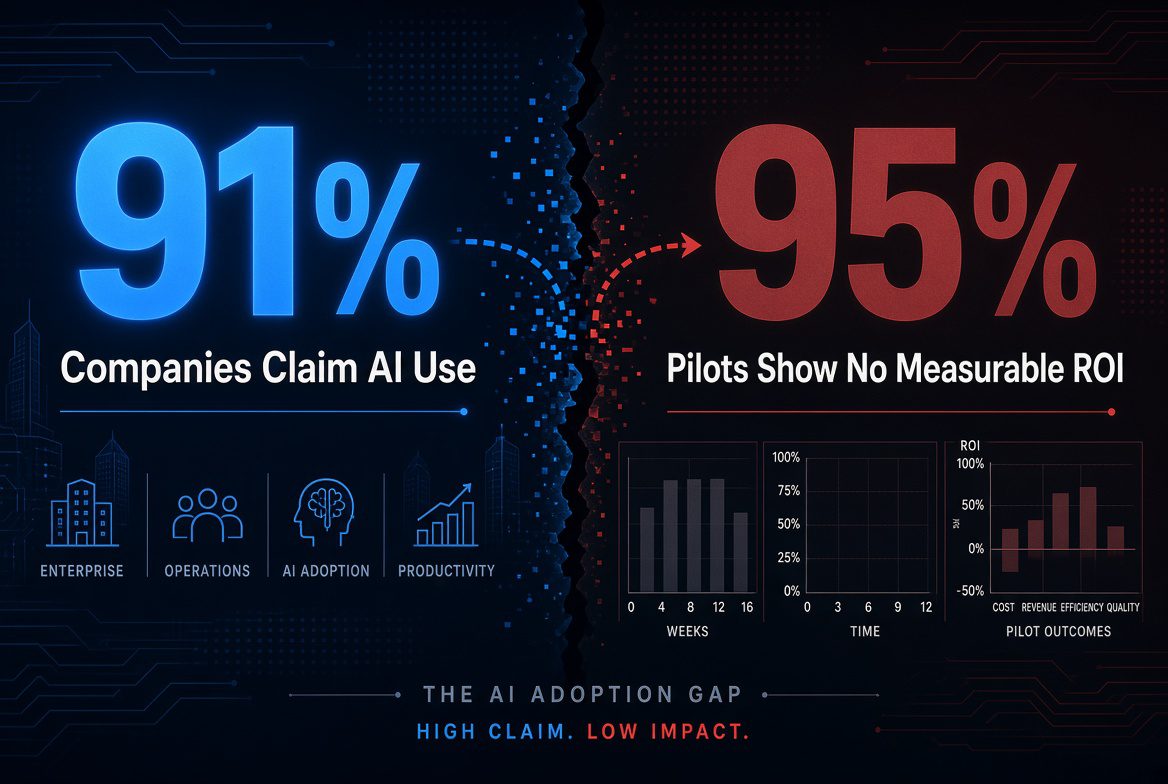
Separately, and on a broader definition, McKinsey’s own tracking shows organizational AI use climbing to 88% in 2025—a 10-point jump from 2024—in its Global Survey on AI (1,993 respondents at all levels, June–July 2025) [Source: McKinsey, “AI at Work but Not at Scale,” 2025]. The frequently cited 91% figure—”91% of employees say they use AI for work”—comes from a different, older McKinsey study: Superagency in the Workplace (published January 2025, based on an October–November 2024 survey of over 3,600 employees). It’s an employee self-report of personal tool use, not an organizational adoption figure, and it predates most of the other data in this article by more than a year [Source: HR Dive, citing McKinsey, “Superagency in the Workplace”]. Worth noting for anyone trying to build a clean 2026 picture: it’s one of the most-repeated stats in this space precisely because it’s catchy, not because it’s current.
🔍 Editorial analysis/ Real-World Trade-Off: Watch what happens when you cross McKinsey’s 88% “organization uses at least one AI tool” figure against Pew’s 21%. “AI is part of my job” figure: roughly 65 percentage points of the workforce sit at organizations that have provisioned AI without it becoming part of how people actually work. That gap—not the adoption number itself—is where most of the “we bought licenses and nothing changed” complaints actually live. A rollout that stops at provisioning access, without redesigning at least one recurring workflow around the tool, will show up as “adopted” on a license report and invisible on every productivity metric that matters.
The practical implication for anyone managing a team: adoption dashboards that report “% of staff with AI tool access” are measuring provisioning, not behavior change. [Internal: How to Audit Real AI Usage vs. Licensed Seats] <div id=”adoption-impact-gap”></div>
The Adoption-Impact Gap: Why “Everyone Uses It” and “It Works” Are Different Claims
This is the part most workplace-AI content skips, because it’s the least flattering to sell.
MIT’s Project NANDA published The GenAI Divide: State of AI in Business 2025 in July 2025, based on a systematic review of more than 300 publicly disclosed AI initiatives, 52 structured interviews with organizational representatives, and 153 survey responses from senior leaders collected at four industry conferences between January and June 2025 [Source: Project NANDA / MIT Media Lab, The GenAI Divide, July 2025]. The headline finding: 95% of generative AI pilots delivered no measurable profit-and-loss impact. Only about 5% of integrated pilots produced significant, attributable value.
Two caveats belong next to that number, not buried below it. First, it’s industry research from an MIT-affiliated lab, not peer-reviewed academic work, and the full underlying dataset hasn’t been published—treat it as a well-sourced practitioner report, not a controlled study. Second, the 95% figure measures “no documented P&L impact,” not “the pilot failed outright”: many pilots never had a predefined success metric to measure against, so the honest reading is that most organizations can’t prove ROI because they never defined what ROI would look like—not necessarily that the tool underperformed.
The structural pattern underneath the 95% figure is more useful than the number itself:
| Factor | Higher-success pattern | Lower-success pattern |
|---|---|---|
| Build vs. buy | External vendor tools tailored to a workflow | Internally built tools from scratch |
| Success rate | ~67% when blending internal + external expertise | ~22% for IT-only internal builds |
| Budget allocation | Back-office / operations & finance automation | Sales & marketing “hero projects” |
| Deployment style | Narrow, domain-specific, tightly scoped | Broad, generic, demo-oriented |
| Feedback loop | Tools that retain context and adapt | Static tools with no memory across sessions |
[Source: MIT NANDA, The GenAI Divide, 2025]
🔍 Editorial analysis / Real-World Trade-Off: Over half of 2025 AI budgets went to sales and marketing pilots—the most visible, board-friendly use case—while back-office and operations deployments, which got a fraction of the funding, delivered a larger share of the measurable returns. If your organization’s AI roadmap is led by whichever department has the loudest demo, you’re optimizing for visibility, not P&L.
For individual contributors, the read-through is different but related: Gallup’s data shows workers in management roles who use AI report larger self-assessed productivity gains than individual contributors doing execution-level tasks [Source: Gallup, “Rising AI Adoption Spurs Workforce Changes,” 2026]. That’s consistent with AI being strongest at augmenting judgment-heavy decision work and weaker at fully automating tasks that still require human verification. <div id=”shadow-ai”></div>
Shadow AI: The Workforce Adopted Before IT Did
Here’s the edge case competitor content almost never names precisely: while only about 40% of companies in the MIT NANDA study had official, sanctioned LLM subscriptions, roughly 90% of surveyed workers reported using personal AI tools like ChatGPT or Claude for job tasks anyway [Source: MIT NANDA, The GenAI Divide, 2025].
This is “shadow “AI”—unsanctioned tool use running parallel to, and often outperforming, the officially procured system. It happens because personal accounts have no procurement lag, no mandated workflow, and no compliance review slowing adoption down. It also means the AI usage an organization can see in its licensing data is frequently a small fraction of the AI usage actually happening inside it.
🔍 Editorial analysis / Real-World Trade-Off: The uncomfortable trade-off most governance policies miss: Sanctioned tools that log and review every query create a chilling effect where employees stop asking the “dumb,” half-formed questions that actually solve problems, because they don’t want a monitored transcript of themselves thinking out loud. Shadow AI often wins on genuine usefulness, not just convenience, for exactly this reason. SHRM found 30% of workers admit knowingly breaking their organization’s AI rules, and 31% of them said they’d do it again to save time [Source: SHRM, “Navigating AI in the Workplace: “2026”]—which suggests the fix isn’t stricter enforcement; it’s a sanctioned tool with a privacy posture people actually trust enough to think out loud in.
Only 47% of organizations that have adopted AI tools have written usage policies at all, rising to 56% at large organizations and falling to 36% at small ones [Source: SHRM, “Navigating AI in the Workplace: 2026”]. That’s the actual governance gap—not whether employees are using AI, but whether anyone has told them what “acceptable use” means with a specific tool, a specific data-classification boundary, and a specific escalation path. <div id=”workslop”></div>
Workshop: The Productivity Tax Nobody Budgeted For
If shadow AI is the visibility problem, “workslop” is the quality problem—and it has a name now because Stanford’s Social Media Lab and BetterUp Labs gave it one in September 2025.
Workslop is defined as AI-generated work content that looks polished and professional but lacks the substance to actually advance the task: a report full of confident, well-formatted generalities that turns out to contain no real analysis once someone tries to act on it [Source: Stanford Social Media Lab / BetterUp Labs, “Workslop” research, 2025].
Worth flagging before the numbers: BetterUp is a leadership-coaching platform, and a study that identifies “AI is creating a human problem” as the core finding is not a disinterested party—the framing benefits a company that sells human coaching as the fix. That doesn’t make the underlying survey data fabricated, but the dollar figures below are self-reported and extrapolated, not audited financials, and should be read as directional rather than precise.
The study surveyed 1,150 full-time U.S. desk workers. Key findings:
| Metric | Reported figure |
|---|---|
| Workers who received workslop in the past month | ~40% |
| Average time spent resolving one workslop incident | ~1 hour 56 minutes |
| Estimated monthly “invisible tax” per affected employee | ~$186 |
| Estimated annual cost for a 10,000-person company | ~$9 million |
| Workers reporting they felt “annoyed” receiving it | 53% |
| Workers who saw the sending colleague as “less reliable” afterward | Close to half |
[Source: Stanford Social Media Lab / BetterUp Labs, Workslop research, 2025. The $186/month and $9M/year figures are extrapolated from self-reported salary and time estimates — treat as directional, not actuarial.]
🔍 Editorial analysis / Real-World Trade-Off: Workslop is a plausible mechanistic explanation for part of the MIT NANDA ROI gap: an organization can have high AI activity — more documents, more drafts, more meeting summaries generated — while total organizational output barely moves, because someone downstream has to spend real hours verifying, correcting, or quietly redoing what the AI produced. Activity is not the same metric as throughput, and dashboards that only track “AI outputs generated” will systematically overstate value.
The researchers’ practical guidance for managers: set explicit expectations for when AI-assisted work is acceptable versus when it needs a human-authored first pass, and normalize labeling AI-assisted drafts as drafts rather than presenting them as finished analysis.
None of this is abstract to the person actually doing the work. Picture a mid-level analyst who used to own a weekly report end to end — pulling the numbers, deciding what mattered, writing the narrative. Now the numbers get pulled by an agent, the first draft gets written by an assistant, and her job has quietly narrowed to proofreading someone else’s — or something else’s — first pass. She’s faster on paper. She also hasn’t built a new analytical judgment call in months, because the tool made the call before she got to it. That’s the trade-off workplace-AI coverage skips most often: the productivity numbers in this article are aggregate and organizational, and they say almost nothing about whether the individual doing the task is gaining a skill or slowly losing the muscle that used to be the job. <div id=”what-the-five-percent-do”></div>
What the 5% Do Differently
Pulling the threads together — the MIT NANDA build-vs-buy data, the Gallup management-vs-IC productivity split, and the workslop mitigation research — a consistent pattern emerges among the organizations and individuals who report AI actually changing how work gets done, not just how much text gets generated.
A working self-audit — call it the AI Task-Value Check:
- Does this task have a pre-defined success metric? If “faster” or “better” can’t be measured before the pilot starts, it can’t be proven to have worked afterward — which is exactly the trap the 95% fell into.
- Is a human required to verify the output before it moves downstream? If yes, budget that verification time into the ROI calculation instead of pretending it’s free.
- Would a domain specialist, not a general chatbot, do better here? Narrow, workflow-specific tools outperform generic assistants on the tasks MIT tracked.
- Is this a back-office process or a front-stage demo? Back-office automation has historically delivered more measurable return per dollar than the flashier customer-facing pilots that get board attention.
🔍 Editorial analysis / Real-World Trade-Off: The agentic AI shift changes one variable in this framework, not all four. Agents that retain memory across sessions and act (booking, sending, updating records) rather than just drafting text address the “static tool with no feedback loop” failure mode MIT identified. They do not, by themselves, fix the missing-success-metric problem or the verification-time problem — an autonomous agent that executes the wrong action faster is a bigger liability, not a smaller one.
Actionable Implementation Checklist
| Step | Action | Owner |
|---|---|---|
| 1 | Calculate your shadow AI leakage gap: compare sanctioned-tool query volume against a rough estimate of total AI-assistable task volume by department. A large gap tells you which teams have quietly opted out of the official tool | IT / Data |
| 2 | Run a “workslop drill”: have each manager identify which recurring deliverables on their team could be fully AI-generated without anyone downstream noticing — then redesign that specific workflow instead of banning the tool | Team managers |
| 3 | For each active pilot, write down the one metric it must move and the pre-rollout baseline before go-live — no baseline means the pilot can never be scored as a success or failure later | Project owner |
| 4 | Reallocate a fixed share of next quarter’s AI budget from front-stage pilots (marketing/sales demos) toward back-office workflows, and require both to report the same throughput metric so they’re comparable | Finance / Ops leadership |
| 5 | Replace a blanket “no personal AI tools” ban with a sanctioned tool that has a stated, narrow data-retention window — chilling-effect resistance to monitored tools is a bigger adoption barrier than most policies assume | Legal / IT |
| 6 | Re-evaluate build vs. buy per initiative: blended internal-plus-vendor builds outperformed IT-only internal builds by roughly 3x in MIT’s sample — treat “build it ourselves” as the higher-risk default, not the safe one | Engineering leadership |
| 7 | Re-run usage measurement quarterly using a Pew-style narrow definition (“is this part of my actual workflow”) alongside a vendor-style broad definition (“have you tried it”) — report both numbers, never blend them into one | HR / People Analytics |
Frequently Asked Questions
What percentage of employees actually use AI at work in 2026?
It depends on the definition. Pew Research puts individual U.S. worker use at around 21%, with roughly 10% using it daily. Gallup’s broader definition — any use, even occasional — puts it closer to 52%. McKinsey’s own 2025 organizational tracking shows 88% adoption of at least one AI tool. The frequently repeated “91% of employees use AI” figure is a different, older (October–November 2024) McKinsey employee survey, not a current 2026 measurement, and gets recycled because it’s a striking number, not because it’s fresh data.
Why do most companies see no ROI from AI even though they’ve adopted it?
MIT’s NANDA research found 95% of pilots show no measurable P&L impact, largely because pilots lack pre-defined success metrics, tools are built generically rather than for a specific workflow, and budgets skew toward visible marketing pilots instead of back-office automation, where returns are more measurable.
What is “workslop” and how big a problem is it?
Workslop is AI-generated content that looks finished but lacks real substance — a term from a 2025 Stanford Social Media Lab / BetterUp Labs study. About 40% of surveyed U.S. desk workers encountered it in a single month, costing roughly two hours of rework per incident and an extrapolated ~$9 million annually for a 10,000-person company; note BetterUp sells workplace coaching, so the framing has a commercial angle worth weighing alongside the data.
Is “shadow AI” a security risk for employers?
Yes, when employees route company data through personal, non-enterprise AI accounts that lack audit logging, data-retention controls, or contractual data-handling guarantees. Roughly 90% of workers in the MIT NANDA sample reported using personal AI tools for job tasks even at companies with official, sanctioned alternatives — meaning the risk exists at most organizations, sanctioned tools or not.
References & Verification Methodology
- Pew Research Center — U.S. worker AI use survey, 2025
- Gallup — Q1–Q2 2026 U.S. workforce panel (22,573 respondents) and related 2026 workplace AI reporting
- SHRM — “Navigating AI in the Workplace: 2026” (5,875 U.S. workers, March–April 2026)
- McKinsey — “AI at Work but Not at Scale” (2025 Global Survey on AI, 1,993 respondents, organizational adoption); the separately cited “91% of employees” figure traces to McKinsey’s Superagency in the Workplace (Jan. 2025, employee survey fielded Oct.–Nov. 2024), via HR Dive
- MIT Project NANDA — “The GenAI Divide: State of AI in Business 2025” (52 structured interviews, 153 senior-leader survey responses, 300+ public AI initiatives reviewed, January–June 2025; industry research, not peer-reviewed, full dataset unpublished)
- Stanford Social Media Lab & BetterUp Labs — “Workslop” research (1,150 full-time U.S. desk workers, August–September 2025; BetterUp is a commercial coaching platform with a stated interest in this framing)
Verification methodology: Every statistic above is attributed to its original research organization, survey wave, and fielding date — not just “2026” — cross-checked against the MIT NANDA report’s own stated methodology rather than a rounded-up secondary summary, with commercial conflicts of interest disclosed where a sponsoring organization stands to benefit from a study’s framing. Figures from surveys using materially different definitions of “AI use” or “adoption” are presented side by side rather than blended into a single misleading number; older statistics (like McKinsey’s frequently recycled 2024-fielded “91%” figure) are dated explicitly rather than presented as current, and the widely circulated MIT 95% figure is presented with its “no documented P&L impact” nuance rather than as a flat failure rate.