
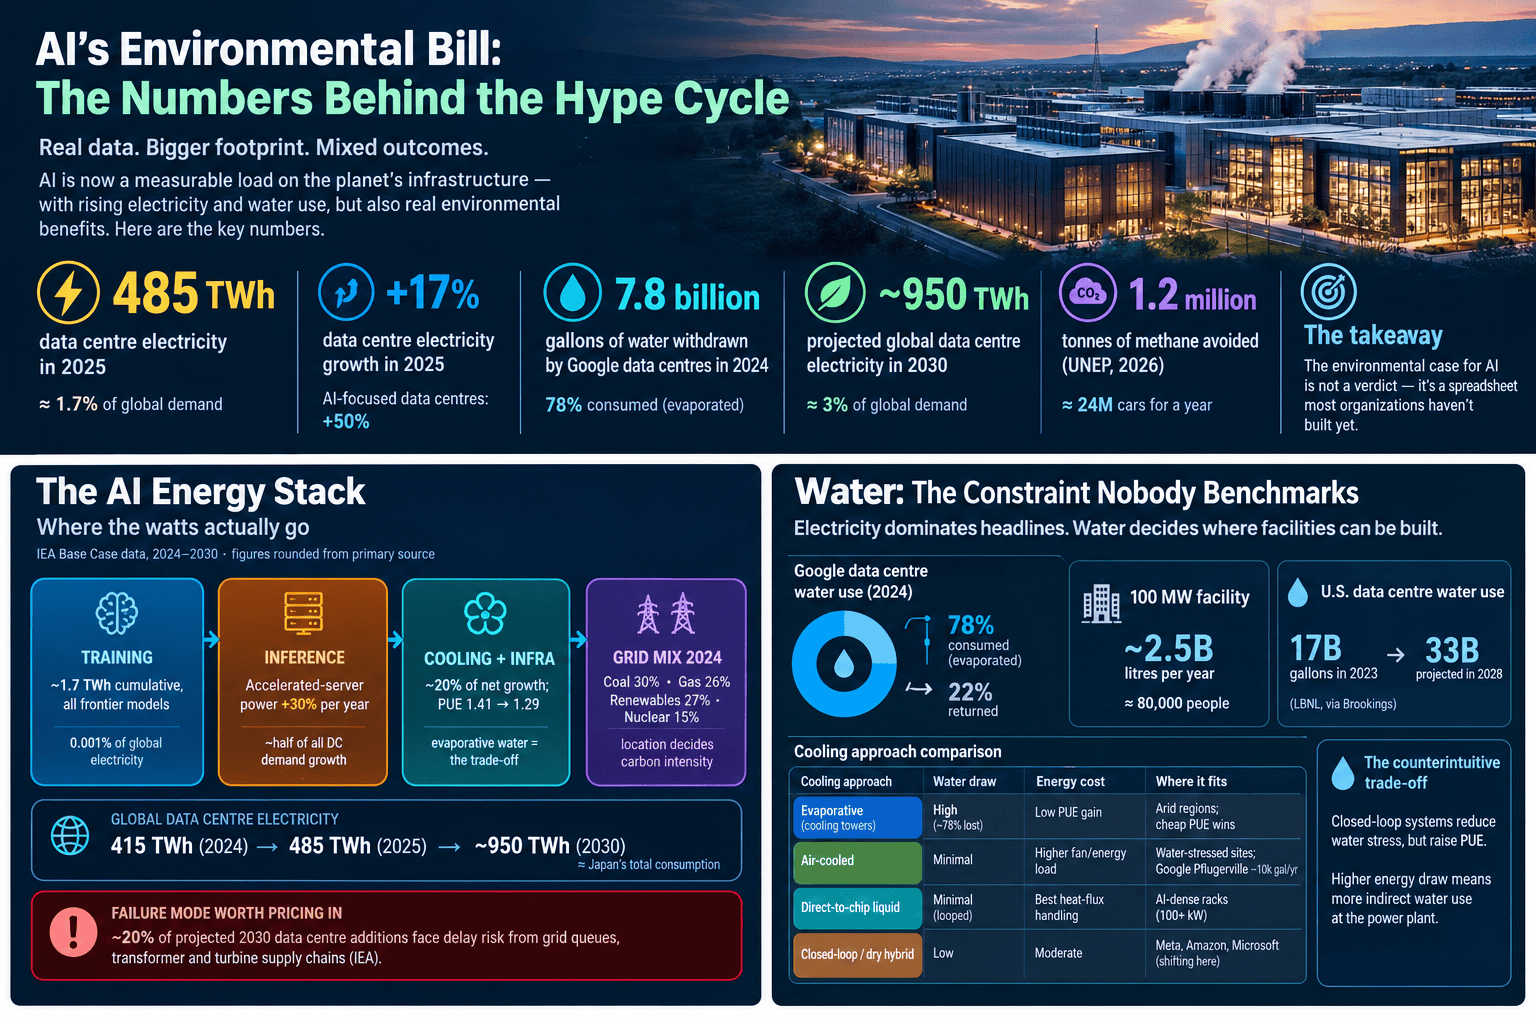
Direct answer: AI is now a measurable draw on physical infrastructure — global data centre electricity use hit 485 TWh in 2025 and the IEA’s Base Case puts it at roughly 945 TWh by 2030, with AI-optimised facilities driving almost all of the growth. Water is the quieter constraint: Google alone withdrew close to 9.9 billion gallons in 2024, of which about 80% evaporated rather than returning to the watershed. The counterweight is real too — AI-assisted satellite monitoring has helped mitigate an estimated 1.2 million tonnes of methane — but that win comes with its own uncomfortable footnote: as of mid-2026, roughly 88% of the system’s alerts still go unanswered. The honest picture isn’t “AI is destroying the planet” or “AI will save it.” It’s a ledger with three columns, and most organisations are only reading one of them.
We’ll call that ledger Draw – Discount – Credit: what AI takes from the grid and the watershed (Draw), what efficiency gains claw back before Jevons’ paradox eats them again (Discount), and what AI gives back through mitigation and forecasting (Credit). According to the data given, every application that is available below can be found among the above columns; in case some application is not found, it means that such information is not available.
TL;DR
- Draw: In 2025 alone, electricity consumption in data centers increased by 17%, and in centers focused on artificial intelligence by 50%. The IEA’s main forecast for 2030 (~945 TWh) now corresponds to Japan’s national consumption.
- Draw, water: Google’s global data centres withdrew ~9.9 billion gallons in 2024 and consumed ~7.9 billion of it — water that doesn’t return to the source.
- Discount: Google cut per-prompt Gemini energy 33x in twelve months. Total demand is still climbing, because query volume is climbing faster than efficiency.
- Credit, with an asterisk: UNEP’s AI-assisted methane detection has enabled 40+ mitigation actions — but only after four years, and only ~12% of the system’s alerts get acted on.
Column One: Draw — The Grid Felt AI Before the Regulators Did
Dublin’s data centres approached 80% of local electricity demand at their peak. Frankfurt hit 42%. Those aren’t projections — they’re stress fractures regulators found after the buildout was already permitted. The physics arrived before the paperwork.
A conventional enterprise data centre draws 10–25 MW. A hyperscale AI campus draws 100 MW or more — roughly the annual electricity use of 100,000 households — and the newest clusters under construction run twenty times that (IEA, Energy and AI). Global data centre electricity climbed from 416 TWh in 2024 to 485 TWh in 2025 — a 17% jump — while AI-focused facilities alone grew 50% in that same year. The IEA’s Base Case puts 2030 demand at roughly 945 TWh, more than double 2025 and slightly above Japan’s total consumption today.
Regional concentration is what most coverage skips. By the IEA’s own regional breakdown, the United States is on track to grow from ~224 TWh to ~426 TWh by 2030, China from ~117 TWh to ~277 TWh, and Asia-Pacific excluding China from ~56 TWh to ~101 TWh — together putting North America and Asia-Pacific at roughly 86% of global data centre electricity use by the end of the decade. Capital is following the same curve: the five largest cloud and AI infrastructure spenders pushed capital expenditure past $400 billion in 2025, on track for a further 75% jump to roughly $715 billion in 2026.
| Region | 2025 electricity draw | 2030 projection (IEA Base Case) |
|---|---|---|
| United States | ~224 TWh | ~426 TWh |
| China | ~117 TWh | ~277 TWh |
| Asia-Pacific (ex-China) | ~56 TWh | ~101 TWh |
| Rest of world | ~88 TWh | ~141 TWh |
A useful sanity check that rarely makes it into the debate: cumulative training electricity across all frontier models tracked by Epoch AI is roughly 1.7 TWh total — about 0.001% of global electricity use. Training is spectacular and small. The dominant, compounding growth driver is inference — the per-query compute that scales with user count, not with how the model was built. That distinction should decide where an organisation’s sustainability policy actually points its levers, because the fix for training energy (better pretraining efficiency) and the fix for inference energy (routing, batching, model sizing) are not the same fix.
Each block above has a distinct lever: model architecture and routing for training and inference, cooling-system design for infrastructure, and power-purchase strategy for the grid. The Credit row is the one most coverage — including earlier drafts of this piece — leaves off entirely.
Column One, Continued: Water Is the Constraint Nobody Benchmarks
Electricity dominates headlines. Water quietly decides where a facility can legally be built, because unlike electrons, water rights are local, finite, and often litigated.
Google’s own 2025 environmental report puts the company’s global data centre water withdrawal at roughly 9.9 billion gallons in 2024, of which it consumed about 7.9 billion gallons — meaning that water evaporated into cooling towers rather than returning to the watershed, a consumption rate of about 80% (Google’s 2025 Environmental Report, reported via GovTech). Site-level variance is enormous: some U.S. and Canada sites withdrew under 500,000 gallons a day, while a handful of the largest AI-dense campuses exceeded 2 million gallons daily. Google’s Council Bluffs, Iowa campus alone withdrew about 1.4 billion gallons and consumed just over 1 billion of it in 2024 — one site accounting for roughly a tenth of the company’s global footprint.
Scale that to the national level: Lawrence Berkeley National Laboratory estimates U.S. data centres consumed 17 billion gallons of water directly in 2023, projecting a near-quadrupling to ~33 billion gallons by 2028. A UK government-commissioned report frames the hyperscale end of that curve directly: a single 100 MW facility can consume roughly 2.5 billion litres a year — about what 80,000 people use (UK government report, 2025).
The engineering trade-off here is poorly understood outside the facilities world:
| Cooling approach | Water draw | Energy cost | Where it fits |
|---|---|---|---|
| Evaporative (cooling towers) | High (~80% of withdrawal lost) | Best PUE per dollar spent | Water-rich regions; cheapest efficiency win |
| Air-cooled | Minimal | Higher fan/energy load | Water-stressed sites; trades water for electrons |
| Direct-to-chip liquid | Minimal at facility, mostly looped | Best heat-flux handling per rack | AI-dense racks (100+ kW); the industry’s stated direction |
| Closed-loop / dry hybrid | Low | Moderate-to-high | Meta, Amazon, Microsoft have all announced shifts here |
The counterintuitive finding, and the one metric-gaming most readily exploits: switching to closed-loop or dry cooling for new AI “factories” doesn’t eliminate the water problem — it moves it. Dry cooling raises PUE, which raises electricity draw, which raises indirect water consumption at whatever power plant supplies that electricity. Water accounting that stops at the facility fence line systematically understates the true footprint. Any vendor water claim that doesn’t specify “withdrawal vs. consumption” and “direct vs. indirect” should be read as incomplete, not false.
Column Two: The Discount — Why Efficiency Gains Aren’t Winning Yet
The efficiency numbers are genuinely good. Between May 2024 and May 2025, Google cut the median energy per Gemini prompt by a factor of 33 and the associated carbon footprint by a factor of 44, through quantization, custom TPUs, and inference-serving optimisation. The IEA projects global average PUE improving from 1.41 to 1.29 by 2030, saving roughly 90 TWh on its own.
And the IEA’s ~945 TWh 2030 projection already includes those gains. That’s Jevons’ paradox doing exactly what it always does: per-query energy collapses, query volume rises faster, total draw still climbs. The 2024-era estimate of 2.9 Wh per ChatGPT-style query — nearly ten times a conventional Google search’s 0.3 Wh — has already fallen toward roughly 0.24–0.3 Wh for a median text prompt. The risk has migrated, not disappeared: long reasoning chains and multimodal generation carry per-task energy that’s orders of magnitude higher, and agentic workflows that chain multiple calls together are the fastest-growing category.
Where most coverage gets the emphasis wrong: efficiency is treated as the whole story. It isn’t. The two binding constraints are (1) geographic concentration — AI demand clusters in a handful of grids, where it hits 42–80% of local load regardless of its modest global share, and (2) embodied emissions, which no per-query metric captures. In the widely-cited BLOOM lifecycle study, 50 tonnes of CO₂e in training emissions broke down as roughly half GPU compute, 29% data centre idle/overhead energy, and 22% GPU manufacturing — a one-time cost amortised over a hardware refresh cycle of 3–5 years, and a liability that compounds with every accelerated-server purchase implied by the industry’s 30%-per-year growth curve.
Column Three: The Credit — And the Footnote Most Coverage Cuts
Here’s where a purely critical framing fails its own evidence test — and where the discipline of citing primary sources instead of press releases actually matters.
Methane. UNEP’s Methane Alert and Response System (MARS), fully operational since 2024, uses AI to triage data from more than 30 satellite instruments. AI-assisted workflows now identify 80–85% of confirmed methane detections before expert review, letting analysts process 12–15x more data than manual review would allow. As of UNEP’s July 2026 report, the system has contributed to more than 40 mitigation actions worldwide, targeting sources estimated to have released 1.2 million tonnes of methane — a climate benefit UNEP compares to removing roughly 24 million gasoline cars from the road for a year (UNEP, July 2026).
That’s the number every outlet covering this report led with. Here’s the number most of them buried or skipped: the response rate to MARS alerts had only reached about 12% as of 2026, up from roughly 1% in 2024 — meaning close to 88% of AI-flagged, human-verified methane alerts still go unaddressed. The constraint was never the algorithm. AI solved the detection and triage problem years ago; what’s bottlenecked is regulatory follow-through and operator willingness to act on a notification once it arrives. Citing the 1.2-million-tonne figure without that context overstates AI’s realised climate benefit — the technology has done its job; the institutions largely haven’t done theirs yet.
Weather forecasting for renewables. DeepMind’s GraphCast outperformed ECMWF’s gold-standard HRES model on 90% of 1,380 verification targets in a peer-reviewed Science benchmark, and ECMWF’s own operational AI system (AIFS) runs on roughly 1,000x less computing energy than conventional numerical forecasting (Lam et al., Science, 2023). For grids absorbing intermittent wind and solar, cheaper, faster 10–15-day forecasts translate directly into less curtailment and less gas-peaker backup — a genuine second-order emissions credit that has nothing to do with the methane story.
Emissions visibility. Climate TRACE now inventories roughly 660 million emitting assets via AI analysis of 300+ satellites and 11,000+ sensors, including detection of “dark fleet” vessels responsible for 80+ million tonnes of CO₂e that self-reported data missed entirely (Climate TRACE).
Attribution discipline, stated plainly: MARS is a human-in-the-loop system — AI triages, humans verify, governments and companies choose whether to act. GraphCast’s accuracy gains are a benchmark win that operational forecasting teams are still integrating into grid decisions. Neither erases the Draw column. Both complicate a verdict that too much coverage still wants to render as a single number.
Running the Ledger: What an Honest AI Environmental Policy Looks Like
For engineering and sustainability leads, the sequence that actually produces a defensible position:
- Measure per-task, not per-model. Aggregate “we use AI” metrics are ungovernable. Instrument tokens, modality, region, and routing per workload — the Draw column only means something at this granularity.
- Route deliberately. A classification task doesn’t need a frontier model. Google’s 33x per-prompt efficiency gain came from exactly this discipline: smaller distilled models, quantized inference, batched serving. That’s the Discount column, and it’s the one lever entirely inside your own control.
- Treat location as a carbon decision. Globally, coal still supplied 35% of electricity in 2024 against 32% renewables and 9% nuclear (IEA Global Energy Review 2025) — but that average hides enormous spread: a coal-heavy grid can triple the emissions of an identical workload run on a nuclear- or renewables-heavy one. The workload is mobile; the grid isn’t.
- Ask vendors for consumption, not just withdrawal, figures — at site level — and ask whether their cooling design shifts water stress into energy stress. Both answers should be in writing, not in a sustainability PDF’s footnotes.
- Re-verify vendor claims against the IEA’s full scenario band (670 TWh Headwinds to 1,260+ TWh Lift-Off by 2030) rather than a single point estimate. The width of that range is itself the honest signal about how uncertain this is.
- When citing a Credit-column win, cite the follow-through rate too. A detection system with a 12% action rate is a different claim than a mitigation system with a 12% action rate. Say which one you mean.
The failure mode to avoid on all three columns: announcing efficiency gains as emissions reductions, and announcing detection capability as mitigation achieved. Per-unit efficiency with rising total volume is an accounting identity, not a climate outcome. A flagged methane leak that nobody plugs is a data point, not a tonne avoided. The organisations worth emulating publish all three numbers side by side — Draw, Discount, and Credit — and let the reader see where the gap actually is.
Score Your Own Ledger
Before citing this piece in a board deck or a vendor RFP, run your own AI deployment through the same three questions:
- Draw: Do you know your inference energy per task, broken out by model tier and region — or only a single blended “AI usage” number from a vendor invoice?
- Discount: When was the last time a workload was downsized to a smaller or quantized model because the task didn’t need frontier capability — and is that decision logged anywhere, or just informally known by one engineer?
- Credit: If your organisation cites an AI-driven sustainability win (forecasting, monitoring, detection), can you name the follow-through rate — the share of AI outputs that led to an actual action — or only the detection count?
If any answer is “we don’t track that,” that’s the gap in your ledger, not a rounding error in someone else’s.
Bottom line: AI’s environmental footprint is real, geographically concentrated, and growing at roughly 15–17% a year in electricity terms. It is also measurable at the workload level, partially offset by applications with independently verified mitigation value, and consistently reported with the most convenient number in the headline and the least convenient number in paragraph seventeen. The ledger is available. Read all three columns before drawing the verdict.
Sources & Methodology
Primary sources: International Energy Agency, Energy and AI (2025) and its 2026 update; UNEP, Spotlighting Opportunity: How Artificial Intelligence is Accelerating Methane Action (July 2026) and IMEO’s MARS mitigation-case tracker; Lam et al., Science (2023) on GraphCast; Lawrence Berkeley National Laboratory, 2024 United States Data Center Energy Usage Report; Google’s 2025 Environmental Report (via GovTech reporting); UK Department for Science, Innovation and Technology water-use report (2025); Climate TRACE.
Secondary sources: Brookings synthesis of IEA/LBNL data; Luccioni et al. BLOOM lifecycle policy primer; World Economic Forum and E&E News coverage of the UNEP MARS report, used to cross-check the response-rate figure against UNEP’s own mitigation-case tracker.
Known uncertainty: Data centre totals carry wide error bars — the IEA’s own 2030 scenario band spans 670–1,260+ TWh depending on policy and hardware assumptions. Site-level water data remains voluntarily disclosed and non-standardised: a June 2026 Axios report on Google’s water-stewardship pledge cites 7.2 billion gallons of freshwater consumed in 2024 with 4.5 billion gallons (64%) replenished, while Google’s full 2025 Environmental Report (via GovTech) reports 9.9 billion gallons withdrawn and 7.9 billion consumed across all water sources worldwide for the same year. The most likely reconciliation is that the Axios figure is a freshwater-only subset tied specifically to the replenishment pledge, not a contradiction of the full-water total — but neither report states this explicitly, which is itself the standardisation gap this piece keeps flagging. Treat any single Google water figure you see cited elsewhere as needing the same withdrawal/consumption/freshwater qualifier before you reuse it.
Recheck within 6 months: IEA demand projections (updated on a rolling basis), Google/Meta/Microsoft annual water disclosures (published annually, usually mid-year), MARS mitigation-action and response-rate figures (moving quarterly), and per-prompt energy claims (fast-moving and vendor-reported, treat as directional rather than precise).